We return to Stats Corner.
How many points does it take to win every week? We all acknowledge that it comes down to a little bit of luck. It’s whomever the schedule gods default you to year over year the same week. Take Matovina this past week. Historically he’s averaged 91.1 points per game, however he threw down 124.5 against RJ (6th highest in franchise history) but runs into the buzzsaw of RJ’s finest performance yet. RJ’s 144.3 were more than 10 points better than the previous franchise best (133) which came nearly 5 years ago to the week. Coincidently also against Matovina. RJ has played 70 games in this league, only in 6 of them would he have lost to Matovina’s point total this past week.
Let’s take a look at how often a team wins when scoring X amount amount of points. I present to you a graph in black and white.
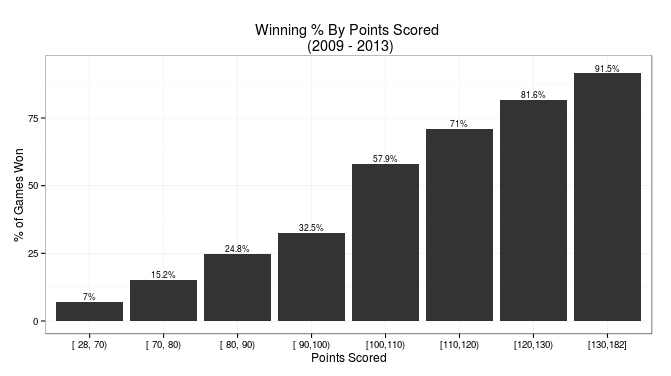
As you expect, the more points you score the more likely you are to win. So if we were to take Matovina’s 124.5 from this past week and consider Hartman’s 119.3, what is the probability both would lose? Basing probabilities on this graph and this graph alone (i.e. not using any additional information such as exact point totals, or the fact that it was a “bye” week in the NFL–more on that in a bit) we get a probability of a little over 5%. Rough week for the Matts (only on the internet; welcome to the world Baby Matovina!).
Just because it’s fun, let’s take a look at who is actually winning that 7% of the time scoring less than 70 points. That has happened all of 4 times. Somehow, Higdon has defied the odds three of those times.
2010 Week 13 Higdon over Harrington 60-57 2011 Week 5 Higdon over Matovina 66.6-59.7 2010 Week 4 Olson over Kane 67-59 2009 Week 8 Higdon over Matovina 69-62.
Well done Higdon.
And the other way, who is losing scoring all those points in the far right column? The database has the answer! And believe it or not Higdon is leading the way on this list too.
2013 Week 2 Hartman over Higdon 173-162.5 2013 Week 5 Ready over Regan 159.1 - 158 2011 Week 13 Regan over Shokunbi 139.2 - 134.1 2012 Week 12 Harrington over Olson 140.6 - 133.1 2011 Week 3 Kane over Ready 133.9 - 131.5
Lastly, I suspected that due to NFL “bye” weeks that points must go down. You just can’t sit 4-6 teams worth of NFL starters and have it not. This is indeed the case, as teams score on average 104.2 points during non bye week games and 100.3 during NFL bye weeks. For those of you who care, the p-value for the t-test is 0.02. How does this affect winning probabilities. Quite a lot actually, take a look at this graph. In color!
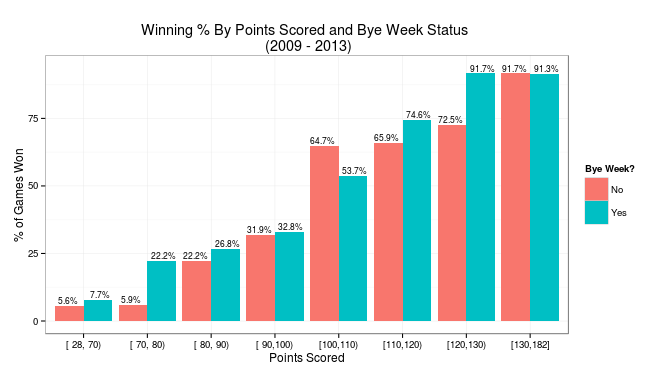
It certainly makes sense that winning percentages are up for the lower point buckets. The only one that doesn’t is the [100,110) range. Any one have any thoughts? These figures make it all the more disheartening for Matovina that he lost this past week. That probability that both he and Hartman would lose posting those point totals falls to a little more than 2%.