Welcome to a very special Stats Corner.
In light of recent emails I felt I should dedicate this week’s post to non-traditional students and the SAT. The National College Review Board has kept statistics on non-traditional students(defined as age 25+ at time of enrolment) since 1983 and…
Just kidding.
This week is special because I’m focusing not on historical game data from our database but rather the ups and downs that accompany me and likewise most of you on Sundays. I’m talking about ESPN’s point projections and how they change over the course of the week. Starting with pre-game projections before the Thursday night game (which I almost captured reasonabley well but King Midas’ came out firing and I missed a lot of data for him) all the way through the Monday night game when you wait to see if you had played Austin Davis over Nick Foles maybe you could have won. But I digress.
First up, let’s take a look at how this past week’s games played out in real time. In these cases if you’re behind, you cling to those projections that “project” you to be the winner. If you’re ahead, you’re rooting for a slow start for their QB in the afternoon game so that when you check back then, the projections now favor you. Either way it’s a recipe for an ulcer for 13 plus weeks every Sunday in the fall. How often did teams experience a reversal of fate this week? The graph below has the answers.

I was surprised to see as the day wore on there weren’t too many lead changes to speak of. The only notable one was Ready and McShane who traded the lead three teams before James ultimately prevailed. Ola and Matovina also battled it out but that was a game that was begging for someone to step up and win, but no one wanted to it seems. Also, look at how limp Himmy’s projection line goes towards the end. Who didn’t step up for you Himmy?
I actually collected many more datapoints than the previous graph indicates. I displayed a limited amount because I didn’t want to crowd out the x-axis. A better approach to this, but one that’s hard to track as the day goes on, is projections based on how many minutes each team has left of gameplay. Unless the two teams have players playing in roughly the same time slots on Sunday and Monday nights you’re going to have one team sweating it out trying to hold on, while the other prays for 48 yards and one touchdown from Pierre Garcon. You wouldn’t think that would be too much to ask of Kirk Cousins, but I digress.
So here is a graph that represents points scored and projected as a function of minutes remaining. Each point on the graph indicates an acutal data measurement while the lines are playing connect the dots. This is the exact same data from before, just displayed differently.
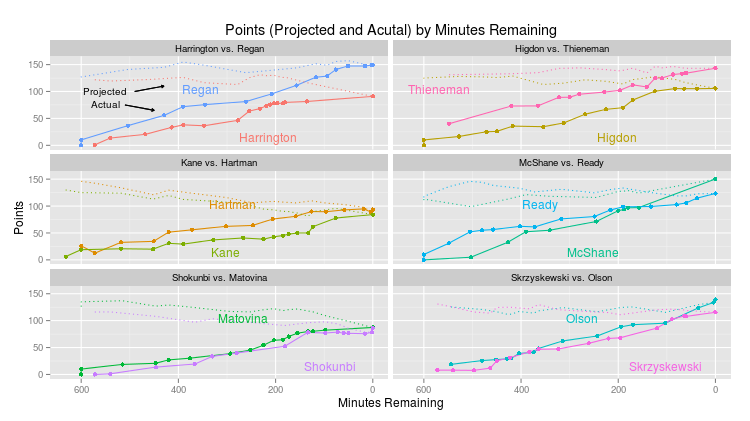
Here we don’t see the lead changes in the Ready/McShane game. The Matovina/Shokunbi match-up is still close, though it looks like Matt Mat has a beat on it the whole way. Olson/D’Skae also appears much more in doubt than in the day/time figure, and up until 60 mintues or so remaining for both teams is a true toss-up. Himmy still fades super fast at the end.
As a reminder, all data and code used to create these graphics in R can be found here