Does Hartman Have a Shot at the Proportional Wins (PW) Record?
Let’s take a look at the leaderboard of most PW through 10 weeks.
| Year | Owner | PW Through 10 Weeks | PW Season Total | All Time Rank |
|---|---|---|---|---|
| 2011 | Shokunbi | 7.45 | 10.09 | 1 |
| 2014 | Skrzyszewski | 7.45 | 9.45 | 2 |
| 2013 | Ready | 7.18 | 9.18 | 4 |
| 2016 | Hartman | 7.09 | NA | NA |
| 2015 | Harrington | 6.91 | 8.55 | 8 |
| 2009 | Regan | 6.78 | 9.00 | 6 |
| 2011 | Ready | 6.73 | 8.36 | 10 |
| 2012 | Ready | 6.73 | 9.09 | 5 |
| 2009 | Shokunbi | 6.67 | 9.00 | 6 |
| 2012 | Hartman | 6.64 | 8.18 | 11 |
So if you’re paying attention you’ll see Hartman, currently the 4th best team through 10 weeks, has got a chance to tie 2011 Team Shokunbi for best single season performance. But he’s got to score the most points every week for the next three weeks.
Am I Having One of the Unluckiest Season Ever?
It feels like I am. Let’s see:
| Year | Owner | Luck Through 10 Weeks | Season Total Luck | All Time Rank |
|---|---|---|---|---|
| 2012 | Higdon | -3.00 | -3.73 | 1 |
| 2016 | Kane | -2.45 | NA | NA |
| 2010 | Kane | -2.36 | -1.36 | 10 |
| 2013 | Higdon | -2.09 | -2.73 | 3 |
| 2015 | Harrington | -1.91 | -1.55 | 8 |
| 2012 | Shokunbi | -1.82 | -1.36 | 10 |
| 2009 | Regan | -1.78 | -1.00 | 15 |
| 2011 | Ready | -1.73 | -1.36 | 10 |
| 2015 | McShane | -1.73 | -1.09 | 12 |
| 2010 | Ready | -1.55 | -1.00 | 13 |
So I’m the 2nd unluckiest team ever through 10 weeks. I’ve still got time to get myself off this list. You’ll notice luck through 10 weeks isn’t necessarily indicative of season ending luck. That means there is still time for some poor bastard to climb this leaderboard on their way to missing the playoffs.
Is Olson Having One of the Luckiest Seasons Ever?
Again, it sure feels like it. Let’s see:
| Year | Owner | Luck Through 10 Weeks | Season Total Luck | All Time Rank |
|---|---|---|---|---|
| 2013 | Thieneman | 3.45 | 3.82 | 2 |
| 2011 | Olson | 2.64 | 3.55 | 3 |
| 2016 | Olson | 2.55 | NA | NA |
| 2010 | Higdon | 2.45 | 3.91 | 1 |
| 2013 | McShane | 2.36 | 1.73 | 9 |
| 2015 | Higdon | 2.18 | 2.00 | 7 |
| 2012 | McShane | 1.91 | 2.27 | 5 |
| 2010 | McShane | 1.64 | 0.91 | 19 |
| 2011 | Kane | 1.64 | 1.64 | 10 |
| 2013 | Harrington | 1.64 | 1.82 | 8 |
Nope, just the third luckiest. I’ll note luck through 10 weeks seems more indicative of season ending luck then the analog in the “unluck” situation.
“Can you help settle an arguement between me [Harrington] and the commish and rank each teams WRs (or the top 3-5 WR corps?)
There’s only so much time in the day and I wish I could pull everyone’s data easily but ESPN insists on making it tough for regular folks to access individual league data. But for the sake of this question I was able to pull down Hartman and Harrington’s info. This is data on total points scored by positions starting for each respective team. So if someone scored a lot of points on the bench one week those values are not included here. It’s available in the “Roster Summary” tab for each team. Here’s Hartman and Harrington, by position.
| Position | Harrington | Hartman | Harrington vs Hartman |
|---|---|---|---|
| QB | 389.4 | 381.3 | 8.1 |
| RB | 215.4 | 270.7 | -55.3 |
| TE | 42.9 | 89.9 | -47.0 |
| WR | 294.8 | 280.9 | 13.9 |
So Harrington I suppose you claim the WR crown over Hartman, by about 1.4 points per game. Apart from the less than 1 point/game advantage you have in QBs, Hartman crushes you. Why would you want to bring this up?
“Is this the largest disparity between good and bad teams that this league has seen? Feels like there’s a lot of trash at the bottom of these standings.”
Here’s my methodology for this one: For each season (omit the 2009 season with 10 teams) compare the average PW of the top 3 teams with the average PW of the bottom three teams.
| Year | Top 3 Avg. PW | Bottom 3 Avg. PW | Difference |
|---|---|---|---|
| 2010 | 6.21 | 3.39 | 2.82 |
| 2011 | 6.88 | 2.91 | 3.97 |
| 2012 | 6.45 | 3.55 | 2.91 |
| 2013 | 6.52 | 3.15 | 3.36 |
| 2014 | 6.55 | 3.36 | 3.18 |
| 2015 | 6.39 | 3.42 | 2.97 |
| 2016 | 6.61 | 2.64 | 3.97 |
So this year the discrepency is tied with the one from 2011, at about an average of 4 earned victories difference between the groups. The minimum value is nearly 3 wins, so this is definiately above average, but not remarkable.
FYI: This year the top three are Hartman, Higdon and Regan. The bottom three are McShane, Ready and Harris. In 2011 the top three were Shokunbi, Ready and Harrington. The bottom three that year were Kane, Matovina and Thieneman.
“Are my [Hartman’s] running backs the top in league history? As soon as zeke gets locked up for domestic violence it’s at a minimum tied for the top.”
I don’t have the time to do this question justice, though it is interesting. Lest Hartman get cocky (never!), remember that Ready used to roll with McCoy and Charles when they were at the top of the league.
“Can we add a metric to RJ and Matt mats improvement as a fantasy manager? Are they really better or is it just a fluke?”
Well the season isn’t over so they both could still blow it. But let’s consider through 10 weeks how they’ve done in years past compared to this year. We’ll use my favorite metric, Proportional Wins. 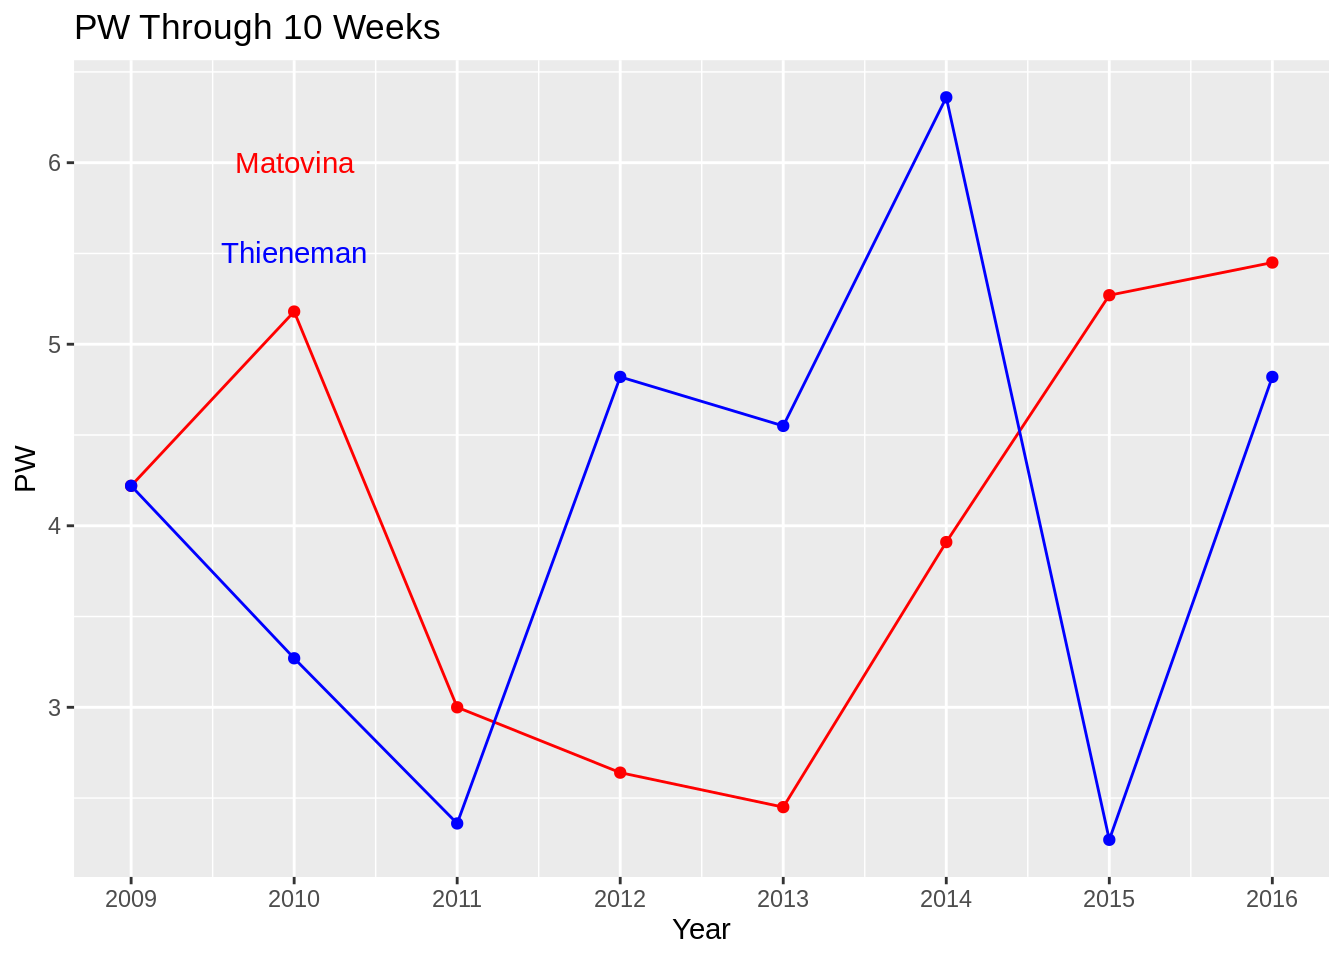
So Matovina has been on an upward trajectory ever since bottoming out in 2013. RJ’s performance is far more eratic. So I think Matovina is for real and RJ needs to put together a solid campaign next season for us to take him seriously.
As an aside, some of the Matovina and Thieneman teams in the past have been complete stinkers. Look at the five worst teams (by PW) through 10 weeks in league history:
| Year | Owner | Total PW |
|---|---|---|
| 2016 | Harris | 2.00 |
| 2015 | Thieneman | 2.27 |
| 2011 | Thieneman | 2.36 |
| 2013 | Matovina | 2.45 |
| 2012 | Matovina | 2.64 |
Hey Ken! Welcome again.
“Obviously a way more difficult stat to track, but I think an interesting one would be who is the”worst" manager of the league? (i.e. whose bench scores more points than players in play, or something along those lines?)"
This is really tough. We have points scored by starters, but points scored by the bench would be really tough to get out, though possible. Maybe if I get fired from my job I can look at that…
“Another fun question to answer would be if WAG’s have changed the production of managers - do single guys (or guys without babies) do worse than those of us who have long-term-spoken-for counterparts? =)”
Very good question. However since the Live Draft was sabotaged by Himmy this year my relationship/baby status updates would be based on old data, for some people years old data. Better to let sleeping dogs lie.