This year for the first time in our fantasy baseball league history we included an obligatory buy-in. The stakes were low, only $25 per team. To increase season-long engagement we made quarterly payouts of $25 to the team with the best record that quarter. The final payouts were $50 to the runner-up and $100 to the champion.
This is how it played out:
- Q1 Winner - Matovina
- Q2 Winner - Olson
- Q3 Winner - Thieneman
- Q4 Winner - Harrington
- Runner-up - Matovina
- Champion - Harrington
There are definitely some names on that list that are new to fantasy success. I think the quarterly payouts were able to keep people focused for short six week sprints. Hopefully it would have reignited some teams that lost interest as their own teams cratered through the first few weeks (or months) and they were able to start with that clean slate every 5 weeks.
History is written by the winners, but what about the losers? Did they also have dollar bills in their eyes as they streamed pitchers on their lunch break? The answers, of course, lie in the data.
Available Roster Moves
For whatever reason ESPN tracks roster moves made by each team. Going back to 2016 we have the following data points available:
- Trades
- DL Assignments
- Acquisitions
- Activations
Trades
Trades have been hard to come by in this league, hardly worth mentioning. This year there were two trades, up from 0 in both 2016 and 2017. That’s all there is to say about trades.
DL Assignments
This is an easy mark for who is paying attention to their teams over the long term. It is quite easy to start a guy who is hurt or just held out of the lineup for a day or two, but to leave guys in the starting lineup with the bright right “DL” next to their name shows you haven’t logged in in a while.
This is also a nosiy metric because you need to have injured players in order to put them on the DL. Despite that I still think there is value in looking at these numbers for this exercise. What does the data reveal? The chart, by owner and year, is below.
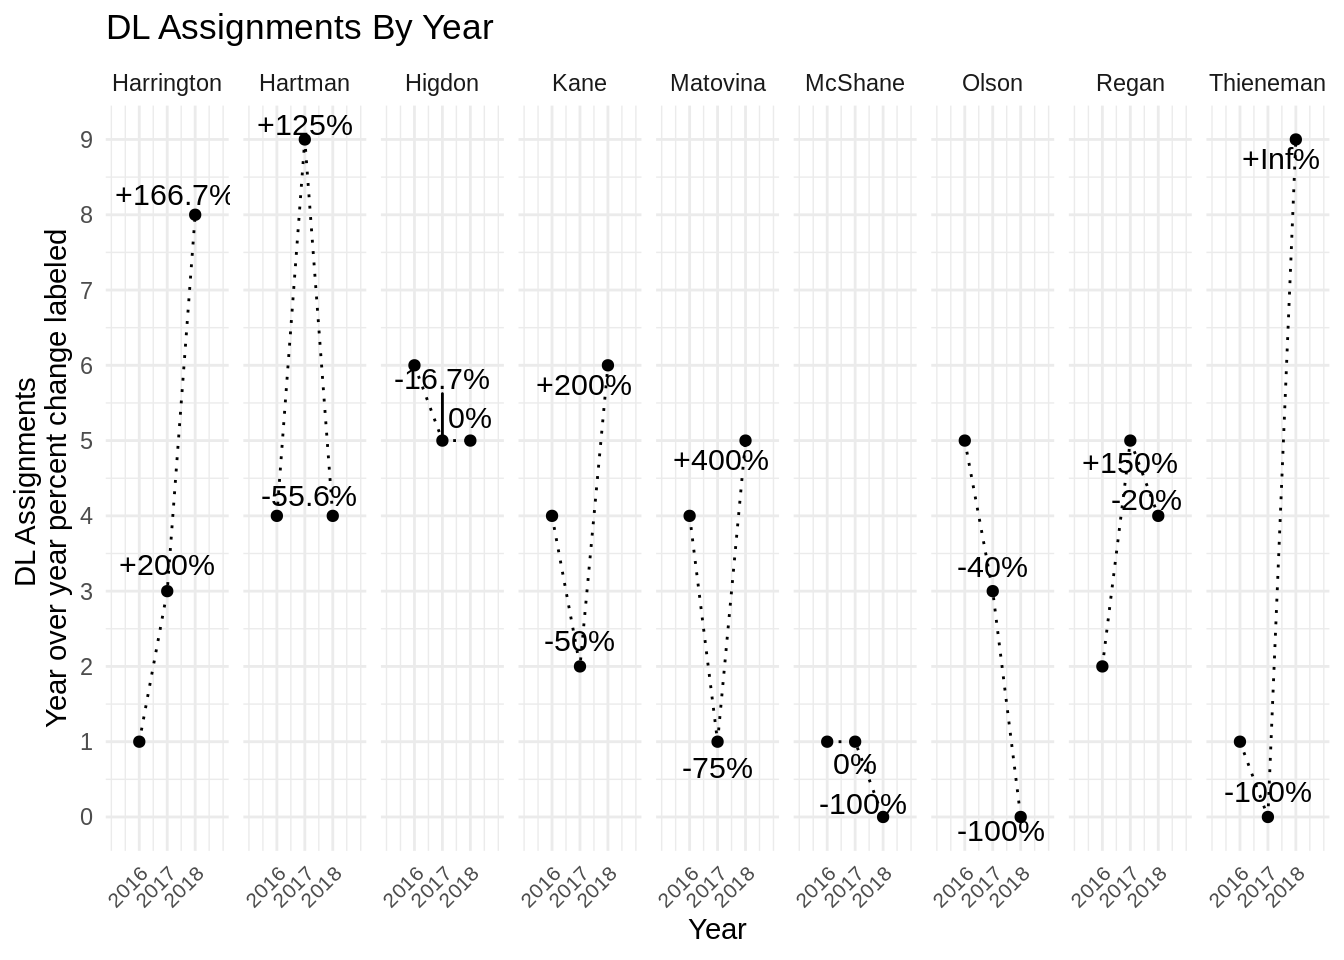
What this chart (and the ones that follow) indicate are the raw numbers of total roster moves made by each owner along the y-axis with owner specific year over year percent change labeling each point. So to illustrate, in 2016 Harrington made 1 DL assignent then 3 in 2017. That is a 200% year over year increase over 2016. Then in 2018 he made 8 DL assignments, which is a 166.7% increase over 2017.
What these charts hope to show is how the new incentive structure influenced individual owners over their baseline values, as well as how each owner’s activity stacks up against the rest of the league.
So what do we see in this one?
- Harrington and Hartman have both been very active every year. Hartman’s engagement with DL assignments actually dropped this year.
- We see big jumps this year from Harrington (+167.7%), Kane (+200%), Matovina (+400%), and Thieneman (+Infinity).
- Higdon and Regan are active on this front, but are steady year to year.
Acquisitions
What’s refelcted in this stat are those looking to gain a streaming advantage. Alternatively those who have terrible eyes for talent and need to consistently turnover their team to have any hope of eeking out a victory would also score very highly on this metric.
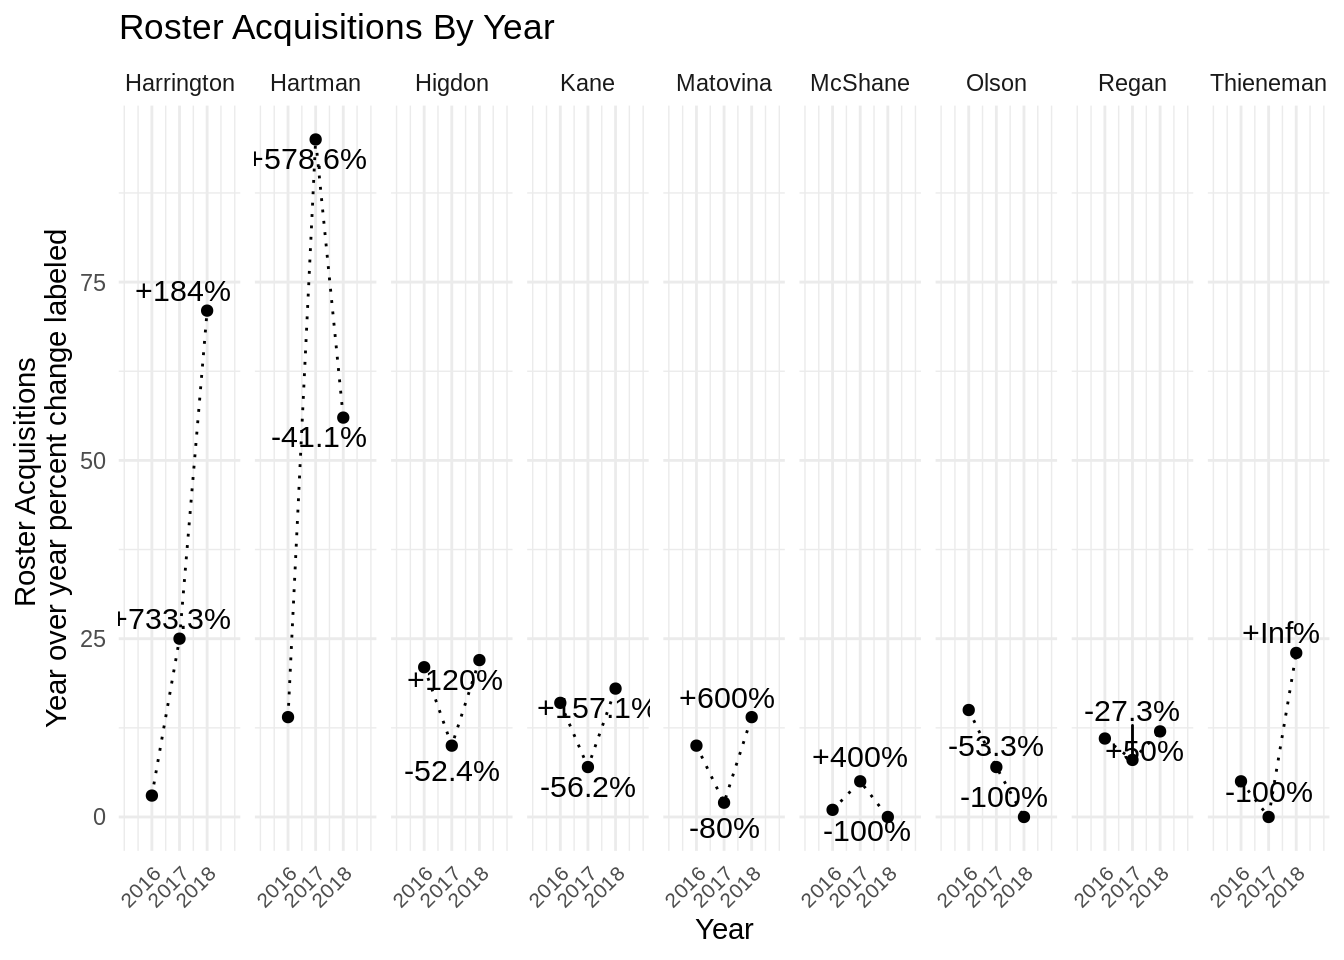
What do I see here?
- Again, Harrington and Hartman are consistently the most active owners with respect to this statistic every year. Hartman especially last year as he chased (and won) the title.
- Most owners have a V-shaped graph here, with the exception of McShane and Olson.
- Thieneman again clocks in with the infinite percentage gain. Somehow he made 0 roster acquisitions in 2017.
- McShane and Olson made 0 roster acquisitions this year.
Roster Activations
We finally come to the key of fantasy baseball, daily dilligence with roster setting. Streaming starting pitchers from your bench, noting off days and last minute scratches from the starting lineup. How did everyone fare?
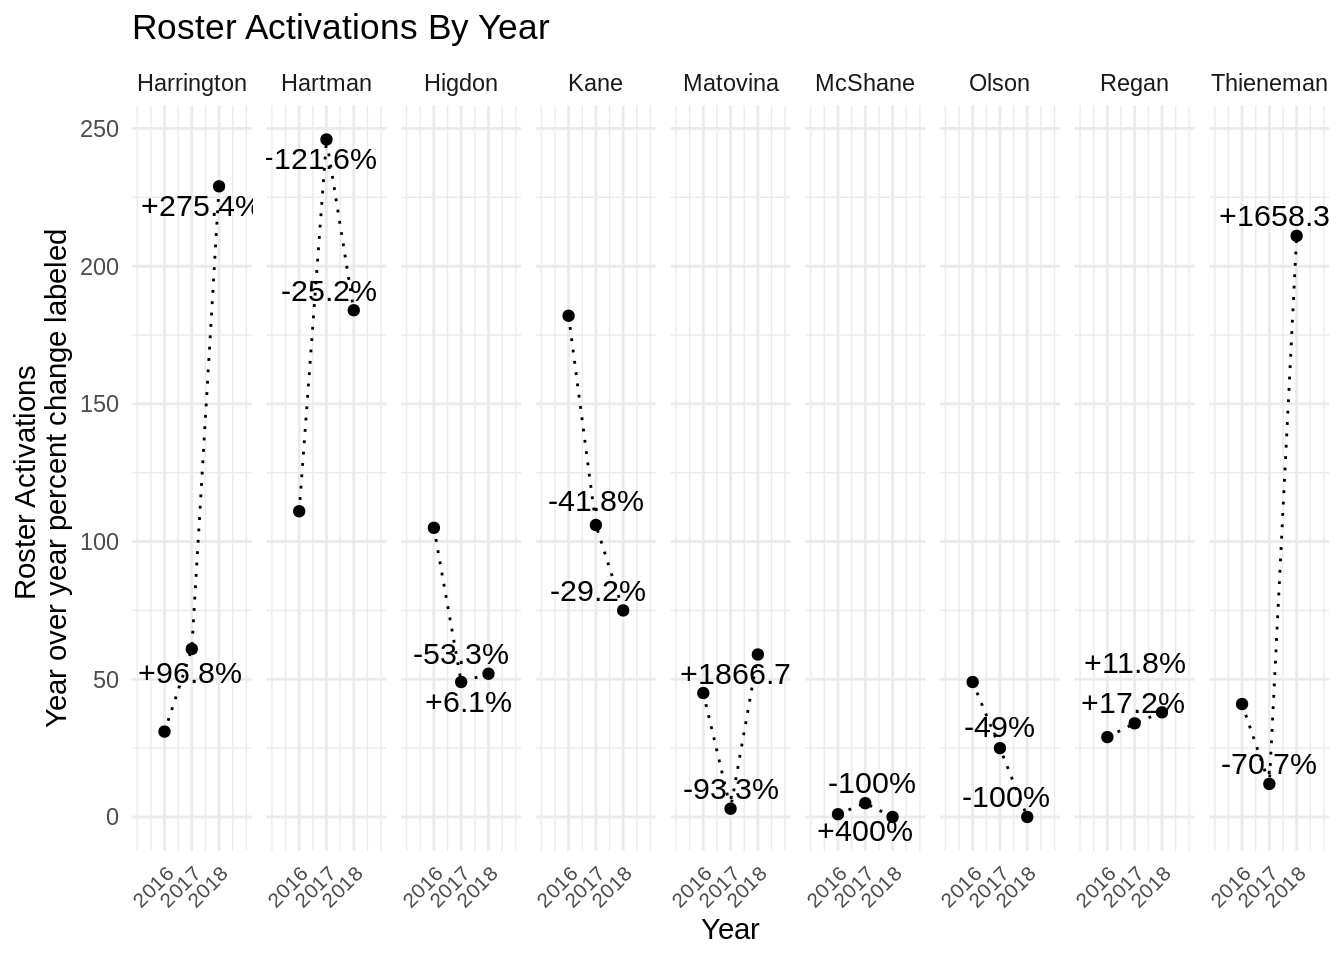
What do I see here?
- Harrington, Hartman, etc.
- Substantial downward trends for several owners (Higon, Kane, Olson).
- Quadruple digit percentage increases for both Matovina and Thieneman.
- Only four owners increased the number of activations this year compared to years past.
Conclusion
- Harrington and Hartman have had a lot of time on their hands for three years running.
- Thieneman chased the $25 payouts mostly through managing a roster rather than turning it over every week.
- Matovina was more active than ever, but still less active than other managers.
- There were no across the board increases in engagement. Only 4 owners made more DL activations, 6 made more roster acquistions, and 4 made more roster activations.